
The Innovative Use of Vector-based Tactile Graphics Design Software to Automate the Production of Raised-line Tactile Graphics in Accordance with BANA’s Newly Adopted Guidelines and Standards for Tactile Graphics, 2010.
By Aquinas Benedict Pather
Mr. Pather is a tactile graphics design specialist/Braille transcriber and the T-Base Communications representative to the Braille Authority of North America’s Tactile Graphics Technical Committee.
Abstract
User-friendly design tools that greatly simplify tactile graphics creation are now readily available to the general public, and are no longer privy to the seasoned graphics artist alone. This article highlights some of the general principles of tactile graphic design, but is primarily geared toward producers and transcribers of tactile graphics who use vector graphics software to design material for microcapsule (swell) paper, thermographic (granulated) ink, computer-embossed graphics, or collage (cut-and-paste) tactile master planning. The best practices that are expounded in the BANA/CBA Guidelines and Standards for Tactile Graphics, 2010, are fully incorporated into these software add-ons or macros. The article demonstrates how the innovative features of these tactile graphics macros are used to create a wide variety of commonly occurring shapes, symbols, and graphs that can be customized with speed and accuracy. Raised-line graphics can now be produced with consistency regardless of the designer because they are drawn automatically by the software.
Keywords
Raised-line tactile, tactile macros, guidelines and standards for tactile graphics, vector graphics
Definition
In this article, raised-line tactile graphics refers to any tangible component of a tactile diagram. Raised-line tactile graphics may consist of linear, areal, or simple point symbols. They are not confined to lines or linear features only, as the title implies.
Tactile Page Layout
BANA/CBA Guidelines and Standards for Tactile Graphics, 2010 has a section dedicated to braille formats, which is specifically related to illustrative material that will be rendered as a tactile to be explored by touch rather than simply being described by the transcriber. Tactilists, who are not certified braillists, would benefit from this section because it gives guidance on placement of the text that surrounds a tactile graphic. Titles, headings, figure numbers, captions, labels, transcribers’ notes, and keys that usually accompany an illustration have standardized formatting preferences that should be followed.
Unit 5 of the Tactile Graphics Guidelines stipulates where, how, and in what order the elements of a tactile graphic should be placed and formatted for optimum readability. The examples in this article attempt to incorporate all of these elements.
Diagram Placement and Layout
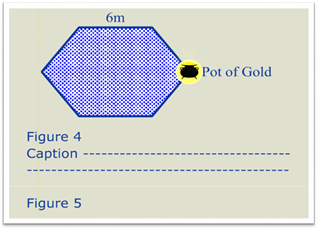
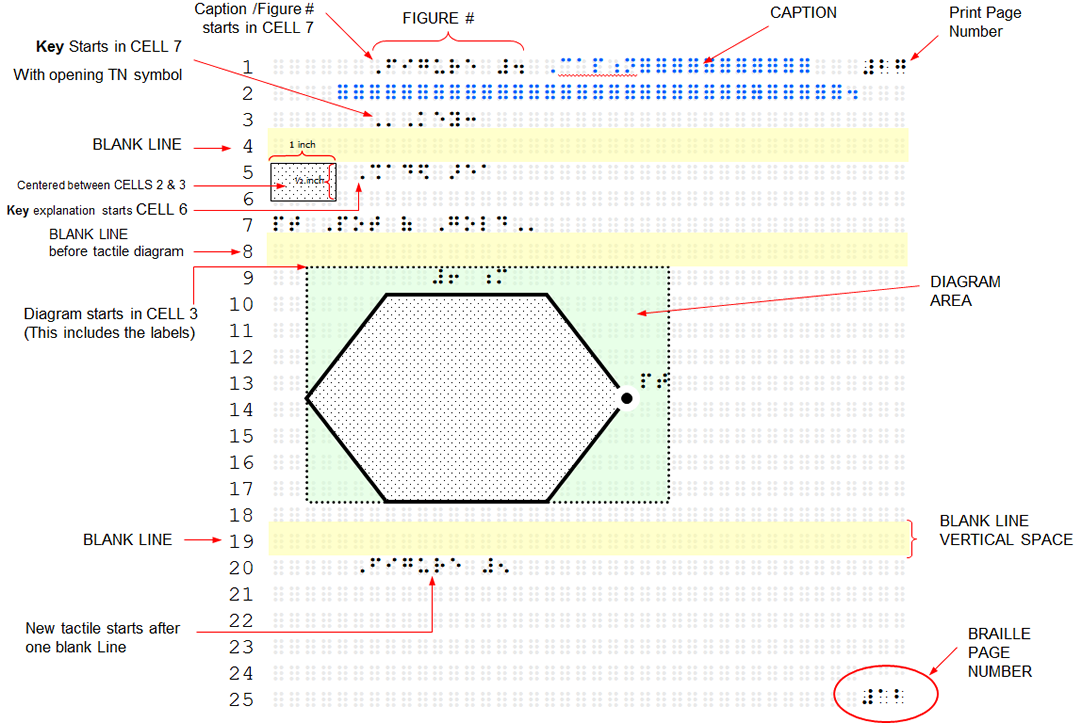
A simple hypothetical print diagram, as in Graphic 1, with labels, a figure number, and a caption is used to illustrate the various format guidelines regarding the placement of the different elements of a tactile diagram, as displayed in Graphic 2. The specific guideline sections that were implemented to create the tactile diagram are listed below. Starting from the first braille line down to the end of the graphic, they are:
- Section 5.2 Order of Elements in a Tactile Graphic: The Figure number and caption are placed before the tactile graphics
- Section 5.5 Illustration Captions: Caption brailled in cell 7 with carryovers in cell 5
- Section 5.7 Keys and Legends: The key starts in Cell 7 with an opening transcriber’s note symbol
- Section 5.8.3 Placement of Keys
- Section 5.9 Symbol Placement and Measurements in Keys: Symbol size and placement
- Section 2.7: Diagram position
- Section 2.7 and Section 5.3.5 Blank Lines in Tactile Graphics
The above list is an indication that besides the readability of a Tactile Graphic, a tactilist or braille transcriber should be aware of the various recommended guidelines regarding the placement of the tactile that is displayed on a typical braille page. Software programming that incorporates these formatting preferences will allow the tactile graphics designer to focus more on the readability of the image. As will be shown later, program add-ons like Tactile Macros have been developed for this purpose.
Templates
Under section 3.4 Planning Size and Layout the guidelines recommend the use of templates. Templates are files that are preset with preferences and standardized settings that serve as a starting point for new projects. Formats and other graphic elements are readily available in the template and do not have to be recreated thus reducing the design time considerably.
Examples of templates using CorelDraw® and Microsoft® Word for producing raised-line tactile graphics are shown below:
- Microcapsule paper (swell touch paper); See Graphic 3.
- Swell touch paper using MS Word 2010; See Graphic 4.
- Tiger embossed graphics using CorelDraw X4; See Graphic 5.
- Thermographic ink using CorelDraw X4; See Graphic 6.
- Thermographic ink using MS Word 2010; See Graphic 7.
Preferences and standard settings that are preset in the templates are: paper size, page orientation, page margins, font type, font size, line and paragraph spacing, measurement units, and many more.
Vector Graphics & Automated Tactile Design
Vector Graphics versus Rasterized Graphics
Curves and shapes are used in vector graphics software to represent images that are based on mathematical expressions. Raster or bitmap images such as JPEGs, GIFs, and BMPs are made up of a grid of pixels. Vector graphics are scalable without the loss of quality to produce clearer images and generally use less memory.
Raised-lines vector graphics are produced with commercial software graphics suites such as: CorelDraw®, Adobe Illustrator®, and Microsoft Word® to name a few. There are also free or open source vector graphics software programs, most commonly Inkscape, Aviary's Raven, Google Docs Drawing, DrawPlus SE, OpenOffice.org Draw, and Karbon--among several others. Tactile graphics designers, who are knowledgeable in the computer graphics field, would very likely be familiar with these commercial or open source software programs. There are also raster-based graphics programs such as QuickTac that produce graphics, which can be imported directly into a braille document.
Macros
Macros allow for the automation of frequently used commands or repetitive sequences of keystrokes and mouse clicks. This greatly speeds up the design time and ensures accuracy as well as consistency. Most graphics software programs allow users to create customizable apps or macros to suit their needs. When using CorelDraw®, for example, there is no need for any programming experience to create macros. With computer programming experience, modifying and editing macros can be simple using the Visual Basic for Applications editor (VBA).
Tactile Macros
The macros discussed in this article, named Tactile Macros, were created by Debra Graham, a computer programmer who has volunteered as a tactile graphics designer for many years. The many features that the macros have today are as a result of the input and support of the original group of tactile macro users. New ideas for add-ons are constantly being tested and updated as more time-saving innovations are included. The macros are freely available to anyone who joins the Google Groups forum at: https://groups.google.com/forum/?hl=en&fromgroups#!forum/tactile-macros.
Some of the many functions that are most commonly used in the latest version of the Tactile Macros for CorelDraw® are: setting braille code preferences (e.g., Nemeth Code for lower numbers or Literary Code for upper numbers), adding dead zones (i.e., white space) with the recommended thickness around diagrams and braille with a single click of the mouse, and adding pages with both braille and print page number placeholders.
There is also a function to quickly fix braille font problems that are accidently introduced or are overlooked. For example, with one click edits can be made such as correcting braille font type, rectifying braille distortions and font size, exposing accidentally hidden text, etc. However, this is not a translation program and therefore braille contractions and symbols are not interpreted for correction by the Tactile Macros program.
Other functions include the ability to quickly draw and/or edit mathematic graphics in accordance with BANA standards by merely entering the parameters specific to the graphic. Some of the diagrams that can be quickly drawn with the macros are:
- Cartesian Graphs
- Line Graphs
- Bar Graphs
- Pie Charts
- Spinners
- Histograms
- Specific Angles or Triangles
- Dot Grids
- Number Lines
- Clocks
The Tactile Macros have expanded considerably over the years and now also include many shortcuts, such as adding geometric symbols to figures, angle signs (acute or right angled), hatch marks for equal sides, chevrons for parallel sides, etc. Shortcuts also include the ability to add repetitive braille text such as keys or legends and commonly used transcriber’s notes. With only a few mouse clicks the macros allow the user to quickly edit graphic features, such as adding standardized textures for common features like water or inserting arrowheads that are based on the styles recommended by the guidelines.
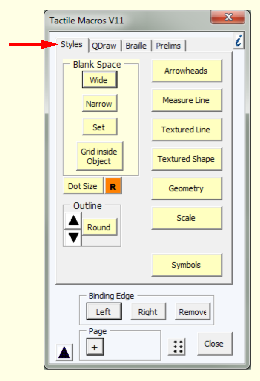
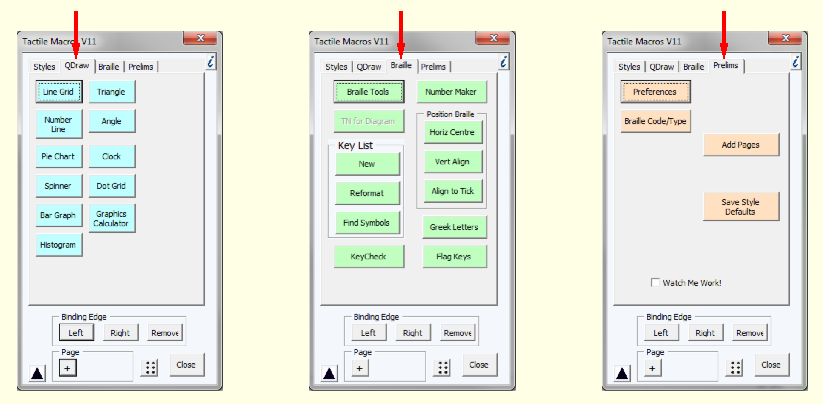
The main menu of the Tactile Macros has four tabs: Styles, QDraw, Braille, and Prelims. These tabs are used specifically for the following attributes and are demonstrated in Graphics 8 and 9.
Styles: For applying standardized features (See Graphic 8)
QDraw: For quickly drawing common graphics (See Graphic 9)
Braille: For applying and correcting braille text (See Graphic 9)
Prelims: For setting design preferences etc. (See Graphic 9)
These macro tools are very helpful when you need to create several graphics that are all similar, whether it is a series of line graphs, a set of analogue clocks, or a number of pie charts. The next five sections demonstrate how the Tactile Macros are used for these purposes.
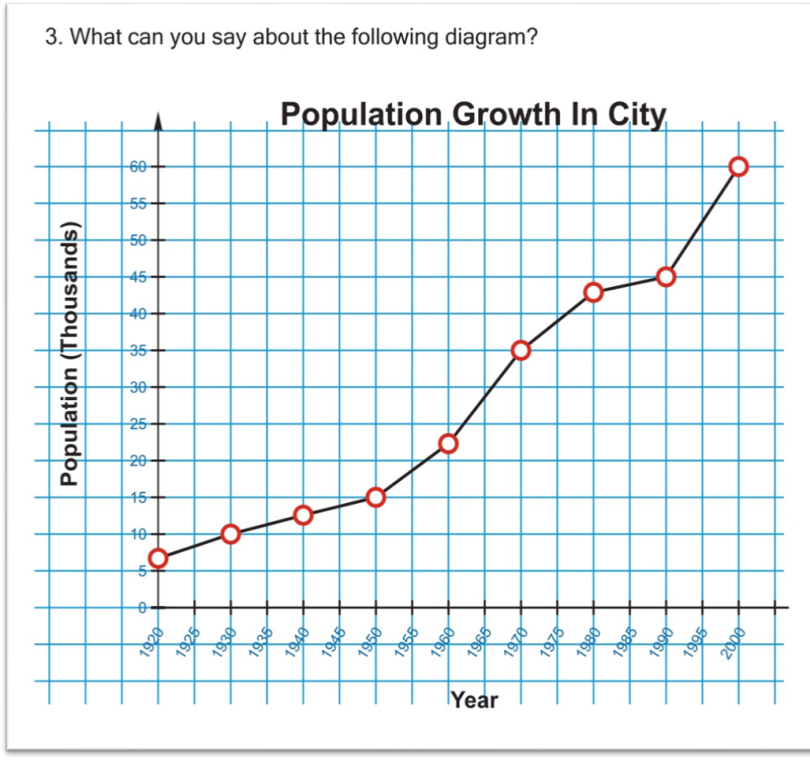
Drawing a Line Graph
The print example of a line graph shown in Graphic 10 is used to illustrate how the Tactile Macros process can quickly draw a line graph without compromising the BANA Guidelines and Standards for Tactile Graphics, 2010. The tedious editing of these types of graphs is greatly reduced because the Tactile Macro can also be used to edit any of the graphic elements that may have been accidently moved or distorted.
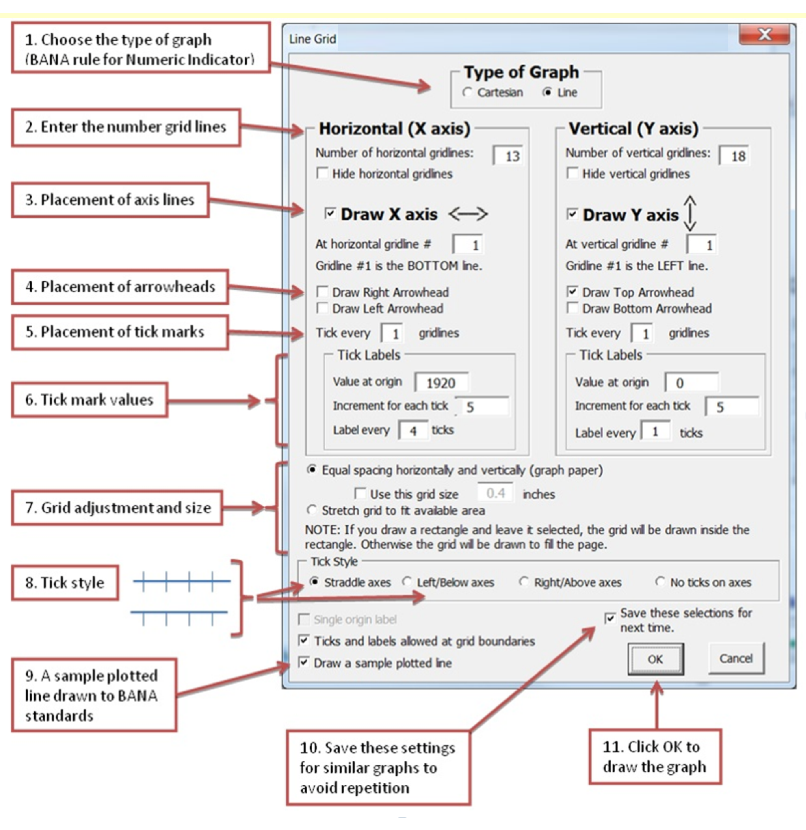
Drawing time is minimized because the designer only has to fill in the line graph properties in order for it to be drawn. The dialogue box in Graphic 11 shows items to be filled in or checked off for this particular print line graph. The graph with a sample plotted curve and placeholders for the braille labels is drawn as shown in Graphic 12. The designer now just has to correctly plot the curves and points. The Dot Size tool, shown in Graphic 13, is available to make sure the plotted points are the optimal size and have the required white space for tactual clarity.
This macro ensures that the following section of the guidelines is adhered to:
Section 3.4.3.11 Point Symbols. For discrimination between two or more different-shaped symbols, the minimum diameter must be at least 1/4 inch (6 millimeters). The space between a point symbol and any other component must be a minimum of 1/8 inch (3 millimeters).
The final step to complete the line graph is to insert braille labels and surrounding text. See Graphic 14 for the tactile example.
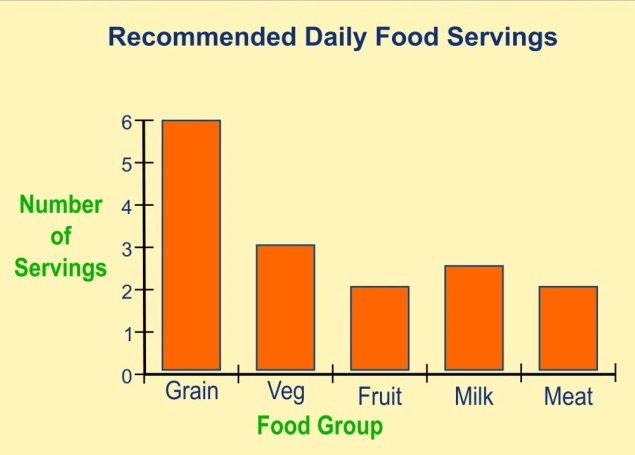
Drawing a Bar Graph
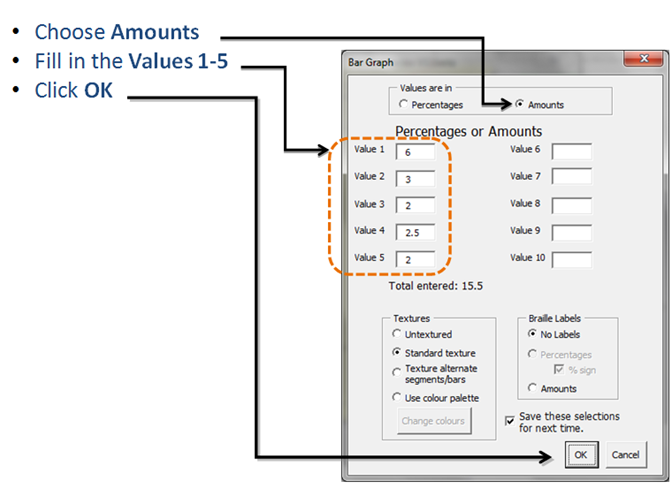
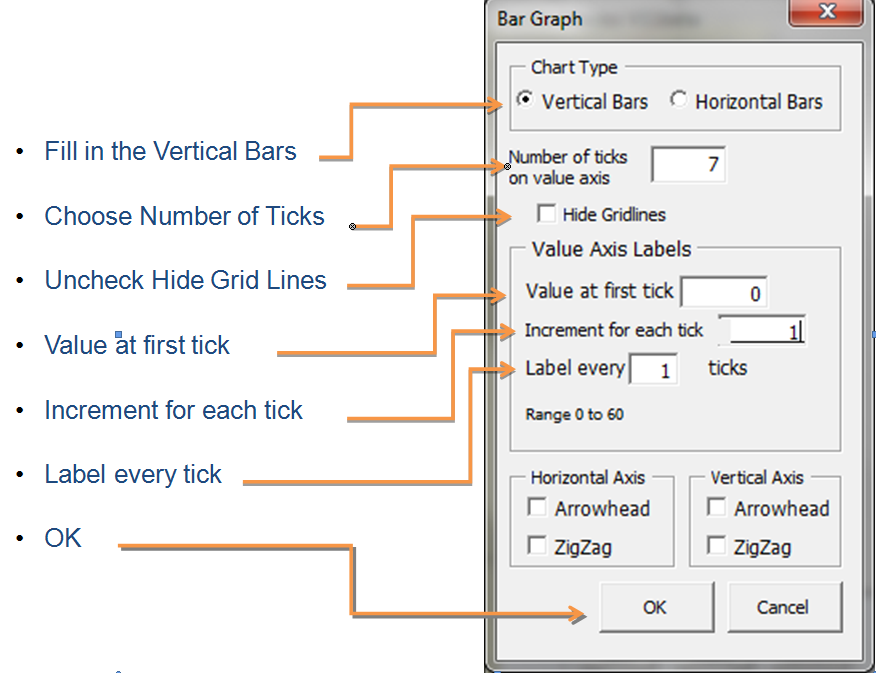
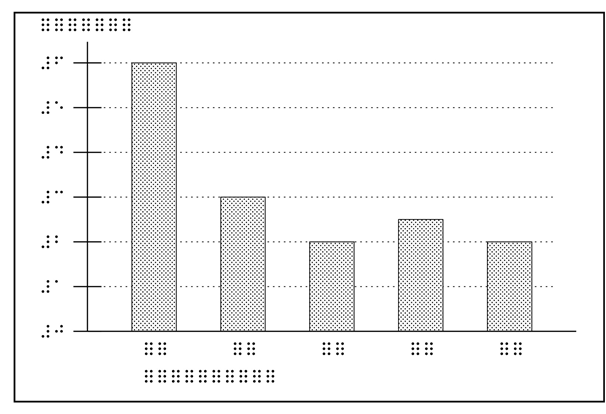
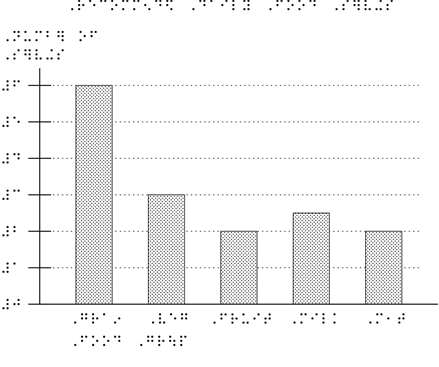
Bar Graphs are commonly used in mathematics and other technical subjects. The print example of a bar graph for this illustration is shown in Graphic 15. Drawing bar graphs using the Tactile Macros is shown in Graphics 16 to 19. The tactile designer’s first steps are to note the values for each bar, draw a rectangle to constrain the size of the diagram, and click the Bar Graph tab to choose the orientation of the bars (horizontal or vertical). The values of each bar of the bar graph (6, 3, 2, 2.5, and 2) are displayed in the Bar Graph dialogue boxes in Graphic 16. Additional graph axis information is used to further customize the diagram as shown in Graphic 17. Once all the data has been filled in, the final bar graph, Graphic 18, will be drawn to fit in the rectangle that was created at the beginning of the process. The braille placeholders are then substituted with the actual labels; see Graphic 19 for the final tactile example.
Drawing a Pie or Circle Graph
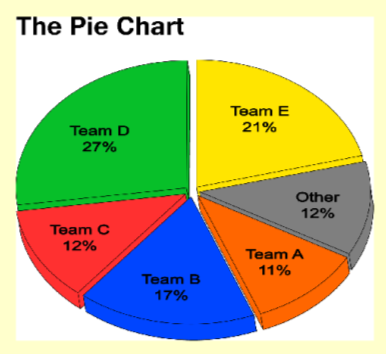
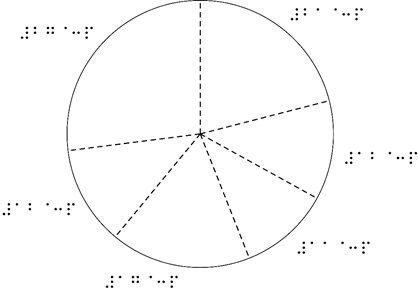
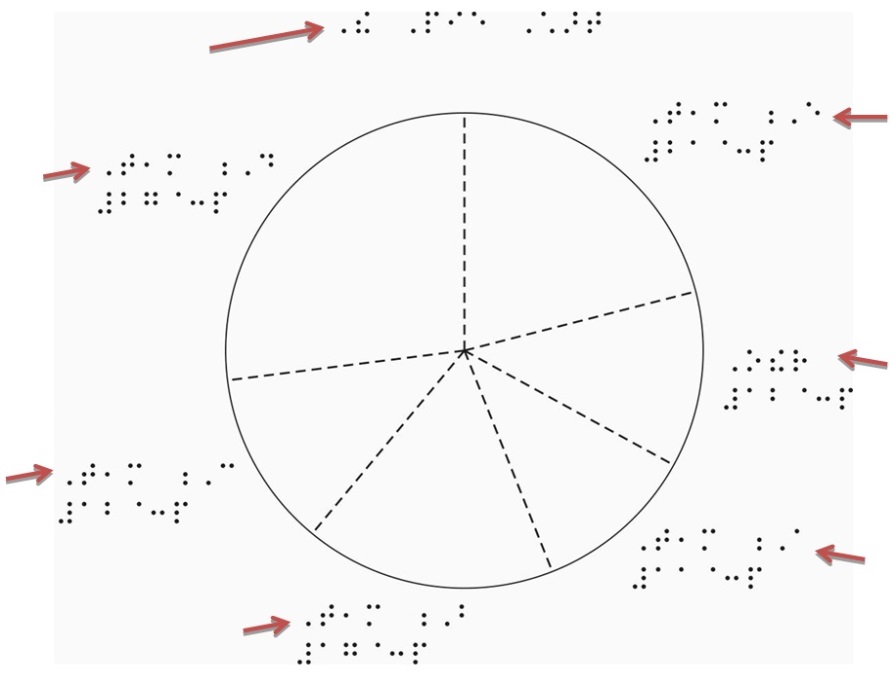
A common pie chart, Graphic 20, is used to show how the Tactile Macros quickly creates a pie chart. The first step is to draw a circle, then on the QDraw tab choose Pie Chart and fill in the values in the dialogue box for each sector (Graphic 21). Once OK has been clicked, the pie chart will quickly be drawn as presented in Graphic 22 and the final step is adding the missing labels. See Graphic 23 for the completed tactile example of a pie chart.
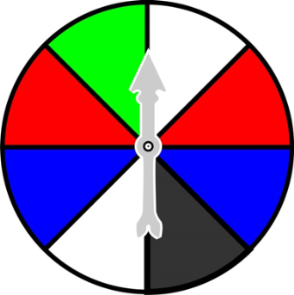
Drawing a Spinner
Section 6.2 Spinners of the guidelines requires that specific properties be shown in a tactile graphic of a spinner. For instance, numbers should retain numeric indicators, segments must be large enough to read, the spinner and segment lines must be distinct, and labels should be placed outside the circle of the spinner, to name a few properties. It is also important to note when creating a spinner that the pointer is shown with an arrowhead and that it does not include a tail.
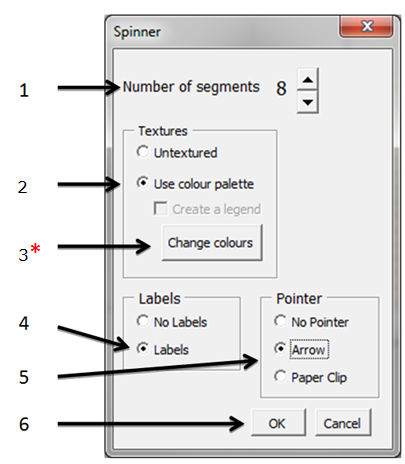
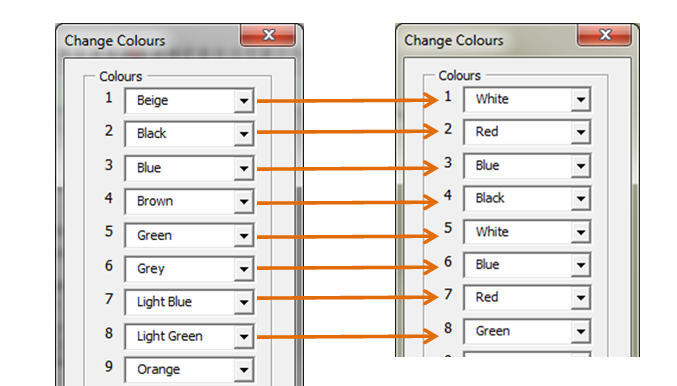
The Tactile Macros add-on incorporates all of these specifications. When creating the tactile of the spinner shown in Graphic 24, click on the QDraw tab, choose Spinner and fill in the next dialogue box as followed in Graphic 25. The following step in creating a spinner is choosing the specific colours of each segment as demonstrated in Graphic 26.
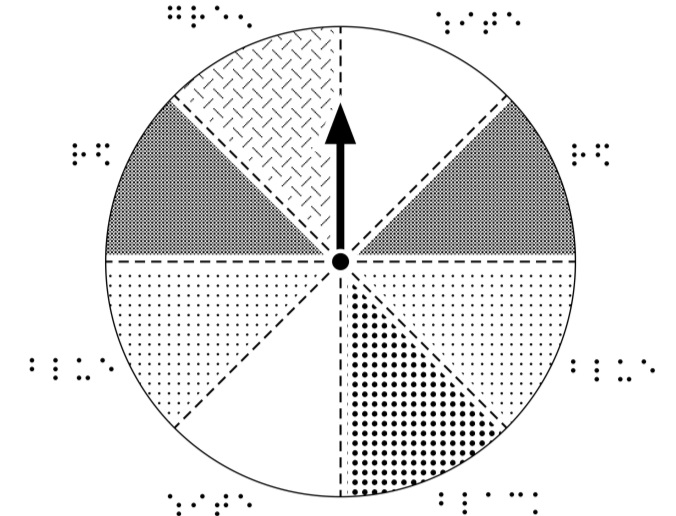
The Macro will then draw the spinner with placeholders for the names of the colours that designers can manually replace if needed. For the final tactile representation of a spinner see Graphic 27.
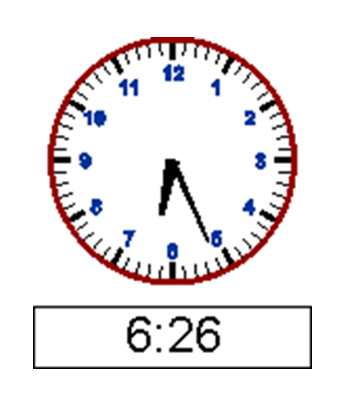
Drawing Clocks
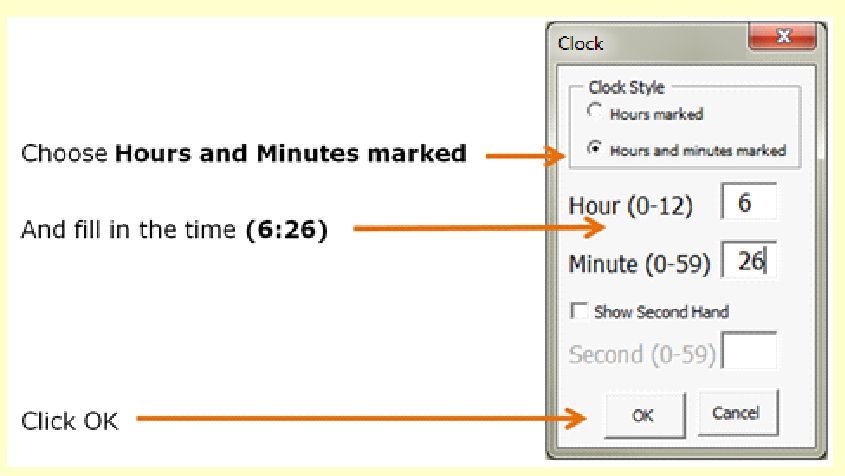
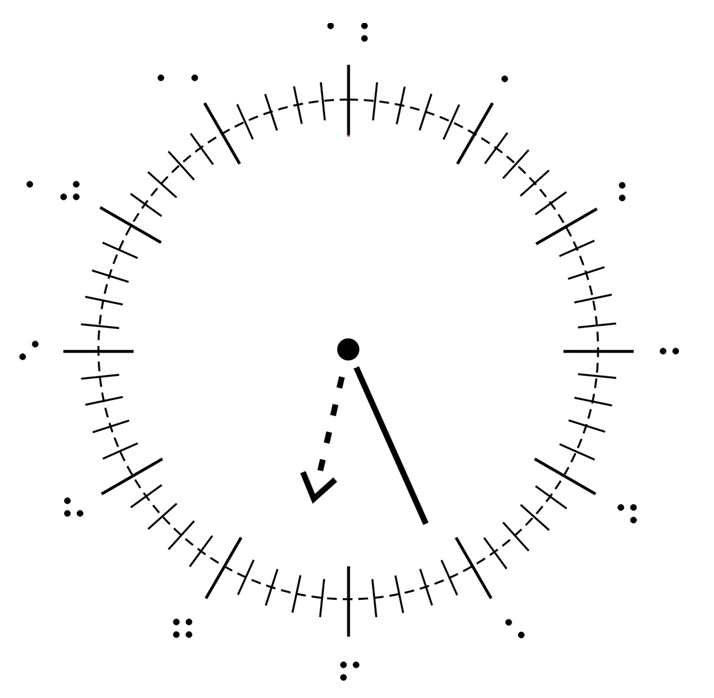
Section 6.1 Clocks of the guidelines concerns the tactile representation of analogue clocks. Tactile Macros is able to quickly render any print analogue clock as a tactile graphic observing all the size and placement restrictions that the guidelines require. The complete process is demonstrated in Graphics 28 to 30.
The print image of a clock, Graphic 28, which often appears in lower grade mathematics textbooks, can simply be created by entering the actual time in the QDraw dialogue box displayed in Graphic 29, which then provides the end result of the tactile clock shown in Graphic 30.
Conclusion
Computer generated raised-line tactile graphics have become more commonly used because they are faster and less expensive to produce than the cut-and-paste graphics for thermoform production. Despite the limitations of microcapsule paper, thermographic ink, and computer embossed graphics, they have become the favoured production methods by many braille production centres. Since the newly published BANA/CBA Guidelines and Standards for Tactile Graphics, 2010, is available in both hardcopy print and online, software programmers now have sound reference material on which to base their designs. The timely completion of transcription projects containing tactile graphics will be greatly facilitated by the use of innovative computer design tools. It is hoped that this article will encourage more programmers to share their expertise to improve tactile graphics design techniques. Such improvements would benefit the tactile reader in general and more specifically student textbooks with tactile graphics, which usually have very tight turnaround times.
References
The Braille Authority of North America. (2011). BANA/CBA Guidelines and Standards for Tactile Graphics, 2010. Retrieved from www.brailleauthority.org
Graham, D. (2013).Tactile MacrosV11. [Online forum entry.] Retrieved from https://groups.google.com/forum/?hl=en&fromgroups#!forum/tactile-macros
Graphic 1: Print Example
Graphic 2: Tactile Example
 |
|---|
Note Text of Graphic 2: Picture showing the format and layout of a tactile graphic. |
Graphic 3: Template for Microcapsule Paper (Swell Touch paper)

Source: BANA Guidelines and Standards for Tactile Graphics, 2010
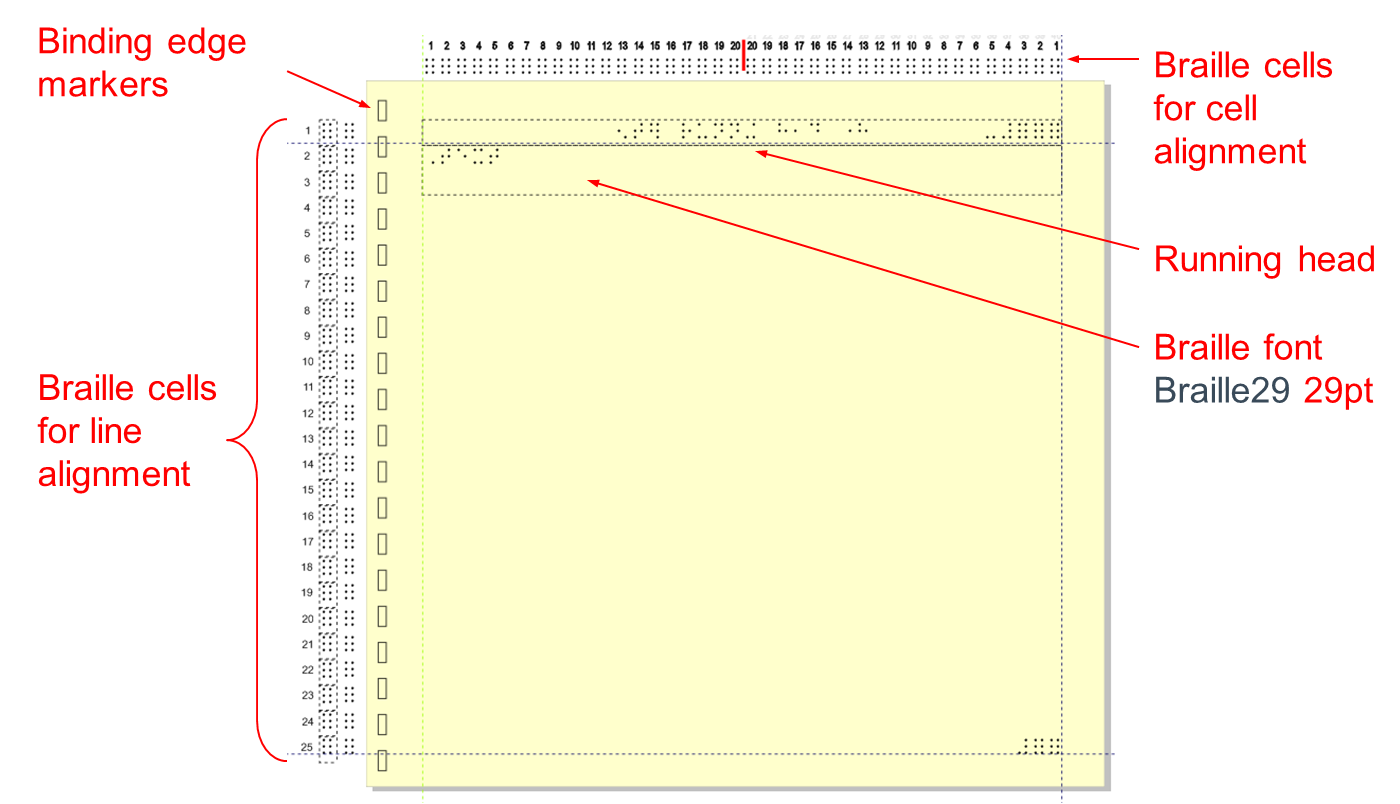
Graphic 4: Template for Swell Touch Paper Using Microsoft Word 2010
 |
|---|
Note Text of Graphic 4: Template for Swell Touch graphics using MS Word with the following specifications: |
Graphic 5: Template for Tiger Graphics Using CorelDraw
Graphic 6: Template for Thermographic Ink Using CorelDraw X4
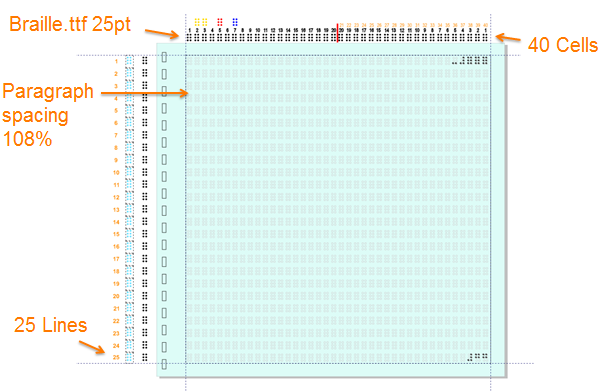
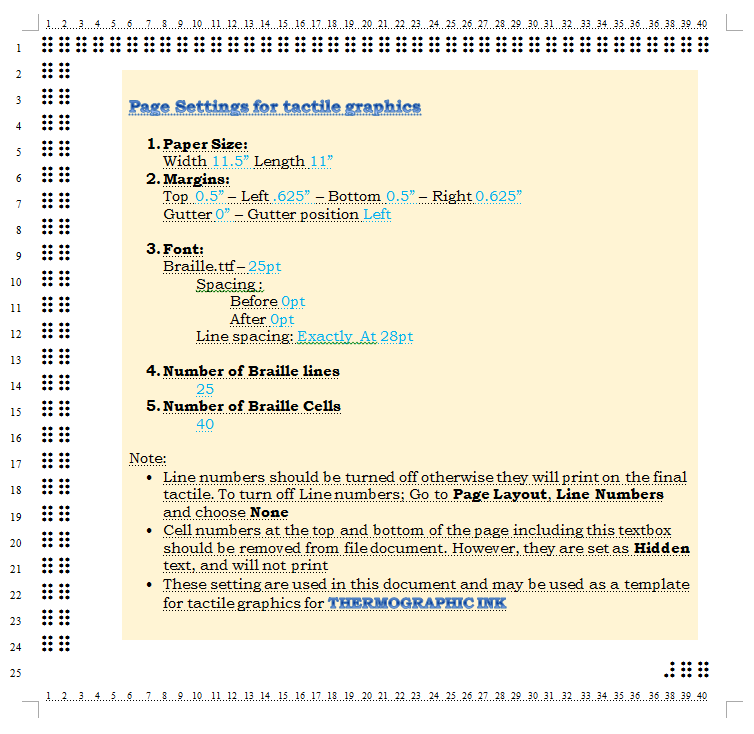
Graphic 7: Template for Thermographic Ink Using Microsoft Word 2010
 |
|---|
Note Text of Graphic 7: Template for Thermographic Ink graphics using MS Word showing the following specifications: Note: These setting are used in this document and may be used as a template for tactile graphics for THERMOGRAPHIC INK |
Graphic 8: Styles tab on Tactile Macros Main Menu
Source: Tactile Macros V11
Graphic 9: QDraw, Braille and Prelims tabs
Source: Tactile Macros V11
Graphic 10: Macro-Generated Line Graph (Print Example)
Graphic 11: Fill in the graph properties in the next window
 |
|---|
Source: Tactile Macros V11 Note Text of Graphic 11: Macro dialogue box with the following items checked or filled in: |
Graphic 12: Line graph drawn with sample plotted curve and placeholders for the braille labels.
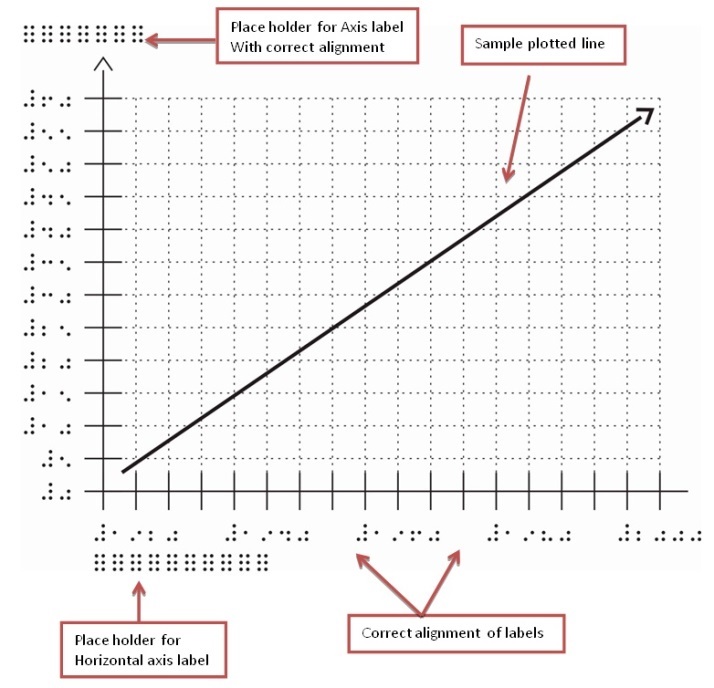
Source: Tactile Macros V11
Graphic 13: “Dot Size” tool used to place correct size plotted points on the line graph
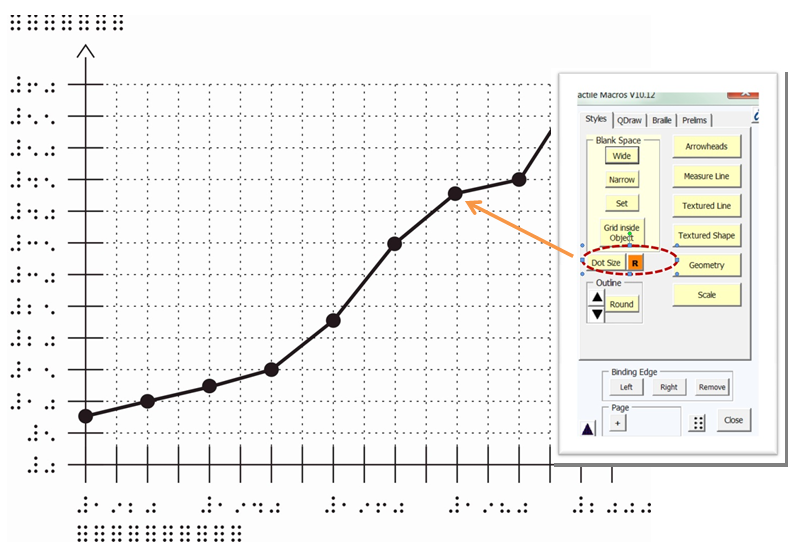
Source: Tactile Macros V11
Graphic 14: Braille Labels – Tactile Example
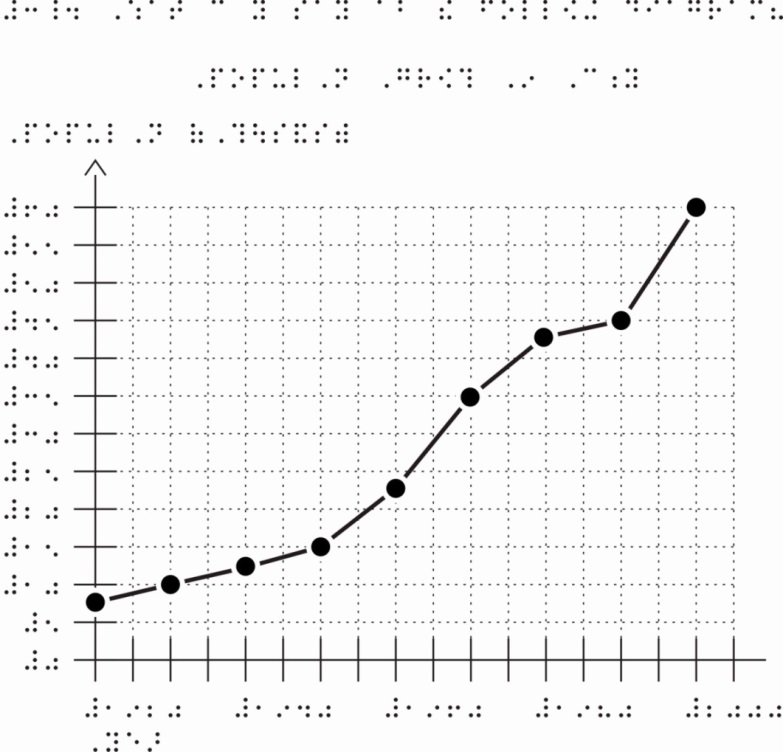
Source: Tactile Macros V11
Graphic 15: Drawing a Bar Graph – Print Example
Graphic 16: Bar Graph Values inserted in required fields
 |
|---|
Source: Tactile Macros V11 Note Text of Graphic 16: Screen shot: Bar graph dialogue box with three areas labeled namely: Choose Amounts, Fill in Values 1-5 and Click OK. The Values chosen are Amounts and Filled in as follows: |
Graphic 17: Bar Graph Type and Properties are entered
Source: Tactile Macros V11
Graphic 18: Tactile example of Bar graph drawn by Tactile Macros
Source: Tactile Macros V11
Graphic 19: Tactile example of Bar graph with braille labels added
Source: Tactile Macros V11
Graphic 20: Pie or Circle Graph - Print Example
 |
|---|
Note Text of Graphic 20: Print example of a Pie Chart shown in 3D and entitled "The Pie Chart" with the following segments (clockwise starting at twelve o'clock): |
Graphic 21: Pie Chart Percentages entered in Value fields
 |
|---|
Source: Tactile Macros V11 Note Text of Graphic 21: Screen shot of macro Pie Chart dialogue box for percentages of the pie chart data with entries (values) filled in as follows: |
Graphic 22: Pie Chart Tactile Example with braille labels
Source: Tactile Macros V11
Graphic 23: Pie Chart with Title and labels completed
Source: Tactile Macros V11
Graphic 24: Print example of Spinner
Graphic 25: Spinner Dialogue Box
 |
|---|
Source: Tactile Macros V11 Note Text of Graphic 25: Screen shot of Spinner macro dialogue box for spinner data. Six items highlighted are: |
Graphic 26: Change Colours on Spinner; Form filled in to match the colours on print Spinner
Source: Tactile Macros V11
Graphic 27: Tactile Example of Spinner drawn by Tactile Macro
Source: Tactile Macros V11
Graphic 28: Clock Print Example
Graphic 29: Clock Tactile Macro
Source: Tactile Macros V11
Graphic 30: Clock Tactile Example
Source: Tactile Macros V11
The Journal of Blindness Innovation and Research is copyright (c) 2014 to the National Federation of the Blind.