
3D Printing Technology: A Unique Way of Making Hubble Space Telescope Images Accessible to Non-Visual Learners
By Noreen Grice, Carol Christian, Antonella Nota, and Perry Greenfield
Noreen Grice is the Accessible Astronomy Educator and Founder at You Can Do Astronomy, LLC.
Carol Christian is the Hubble Space Telescope Outreach Project Scientist at the Space Telescope Science Institute (STScI).
Antonella Nota is the European Space Agency (ESA) Project Scientist and Mission Manager and Space Telescope Science Institute Associate Director for ESA.
Perry Greenfield is a scientist and computer consultant at the Space Telescope Science Institute.
Abstract
Astronomy traditionally is a visual science by which sighted people have contemplated the night sky. Astronomy has also spurred the development of sophisticated telescopes and instruments, featuring capabilities that extend to wavelengths beyond the visible, to record images of celestial objects. While the scientific data from telescopes is somewhat specialized and technical, astronomers routinely process their data to produce visually appealing formats for the public at large and also widely contribute to education and outreach efforts. Astronomical data is treated through image processing techniques including color and intensity choices that result in imagery that best represents the science being investigated in its greatest aesthetic appeal.
Making such astronomical imagery accessible to those who are visually impaired has been a long-standing challenge. Yet, it is recognized that such individuals should have an opportunity to explore, discover, learn about, and contribute to astronomy and science in general. Considerable work has been done by educators, scientists, and artists to make science in general and astronomy in particular more accessible through the use of various technologies, including low resolution tactile images on thermoform and swell-touch pages based on the visual materials. Recently, 3D printers have emerged as a new tool for making reproductions of objects so that they can be useable and understood by a broader community of learners, including the visually impaired.
This article outlines an innovative study that is aimed at taking images of astronomical objects and translating them into a 3D tactile representation of the object’s structure and composition for engagement and discovery by a range of users and learning styles. Using the star cluster NGC 602 as observed by the Hubble Space Telescope as the initial test case, we investigated processes for creating appropriate digital file structures, tested tactile approaches, and utilized focus groups to determine usability of the products.
Keywords
Tactile design, 3D printer, tactile graphic, swell-touch paper, swell-form machine, Hubble Space Telescope, science, astronomy
Acknowledgement
Support for Program number HST-EO-12915.12 was provided by NASA through a grant from the Space Telescope Science Institute (STScI), which is operated by the Association of Universities for Research in Astronomy, Incorporated, under NASA contract NAS5-26555.
Introduction
Astronomy is a particularly effective subject for stimulating curiosity about the world and the laws that regulate it. The quest for understanding our place in the universe has contributed directly to culture, the economy, technological prowess, innovation, and scientific thinking (Rosenberg, Russo, Bladon & Christensen, 2014). Astronomers regularly produce materials for the general public and, by working with communicators and educators, integrate the results of their research into a variety of public venues including school curricula and education initiatives. However, creating materials for wide audiences with different learning styles and challenges is difficult, time consuming, expensive, and possibly less immediately rewarding than writing a research paper. As a consequence, the astronomical material that is currently accessible to those who are visually impaired is very limited.
Visually impaired individuals have a range of accessibility needs (American Printing House for the Blind, 2011), which can be satisfied by a range of resources, including (large) print, Braille, and audio books. Unfortunately, few websites are outfitted with accessibility technologies (Jaquiss 2011, 2012, 2013). Only some of the materials that are transcribed into Braille are accompanied by relevant pictures that have been simplified into tactile versions and verbal descriptions are often substituted if tactile materials are not provided. For all individuals, pictures are important for appreciating and learning about a subject. We believe that making astronomical imagery part of the every day life of visually impaired individuals can assist in stimulating interest in astronomy and, in a broader sense, science.
In this paper we discuss a new and innovative method we have designed and tested for reaching out to tactile learners, particularly the visually impaired. With this method, it is possible to translate astronomical data into tactile forms rendered on 3D printers that can assist individuals in building mental images of the universe around them. We present herein our approach for constructing the 3D materials and our method for arriving at usable tactile objects. We addressed three main questions in the study:
-
What process is required to transform astronomical images and associated scientific data into a digital form appropriate for 3D printing?
-
What textures are most distinguishable and useful to convey scientific information?
-
Can users in focus groups use the 3D prints to get a sense of the astronomical object?
Finally, we describe our long term goal to create a regular production process for 3D astronomical printing. The study described in this paper is the preliminary step necessarily preceding any detailed study of the benefits of using 3D materials for learning or standards-based augmentation of science skills. Subsequently, in the long term we intend to construct a pipeline to produce libraries of astronomical 3D prints for use by educators, students, or other individuals.
The Technology of 3D Printing: Optimizing for Astronomical Data
3D print technology is based on the invention of the solid body imaging process called stereolithography, invented in 1983 by Chuck Hull (SPIE Professional, 2013; U. S. Patent No. 4575330A). A 3D printer uses an additive manufacturing process that builds a 3D object from digital models by adding successive layers of a material in specified shapes. This process is different from machining in which objects are shaped from the removal of material using cutting, drilling, and abrasive techniques.
Although 3D printers have been in existence for some time, only recently have such devices become more common commercially. Today affordable printers are available and are used for a broad variety of purposes including manufacturing airplane parts, medical instruments, and fashion articles. 3D printing technology now has a number of applications in art, construction, industrial design, biotech, military, dental applications, food, aerospace, and numerous other areas, as well as for other remote manufacturing purposes such as constructing parts needed on the International Space Station. Recently, 3D printed items have made their way into education to augment other technologies and tools. The resolution and size of 3D print products vary depending on the sophistication of the printer. Very high quality, precise objects can be created using expensive 3D printers intended for commercial use, while more modest objects can be produced on economical printers for personal or educational use.
Our printer of choice for this project was a MakerBot2 Replicator (Figure 1). The MakerBot2 is capable of making objects within an 11 in. x 6 in. x 6 in. volume (approximately 28.5 cm x 15.3 cm x 15.5 cm) but has a limited memory capacity. The resolution of the printer is as follows: 0.2 mm resolution in z, and somewhat less in x and y, where x and y represent the horizontal stage of the printer. The pixel scales used are driven by printer capability and do not necessarily perfectly match the science data. The astronomical image is about 1300 x 1300 pixels square, while the 3D printer resolution was about 60% of that. This meant that at this resolution the number of available print pixels was less than the resolution of the scientific data.
Figure 1: The Makerbot2 printing one segment of an NGC 602 elevation map.
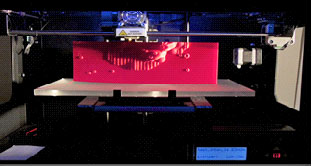
The MakerBot2 printer lays down fine plastic threads extruded through a small hot aperture while moving back and forth across the x-y stage for each layer. When a layer is complete, the platform moves down and away from the extruder, starting a new layer. The resolution in x and y, as well as product smoothness, is primarily a limitation of how sharply the plastic extrusion can change direction due to its physical properties.
Although 3D printers use several file formats, the Stereolithography or Stereo Tessellation Language (STL) format is used by all 3D printers today, including the MakerBot2. Traditionally, STL files are constructed in computer aided design (CAD) programs that produce a digital model of the object being created. Usually these objects can be manipulated and therefore measured accurately and precisely in shape and size. In our astronomical application, the challenge is that the starting point is the image of the astronomical object. Therefore, a custom process needs to be designed to translate the information from the image directly into an STL file.
The second challenge is that the resolution of the printouts we made was lower than the granularity of our science data. Therefore, we conducted experiments to determine what resolution, roughness, and print size would be optimal for the 3D material. Ultimately, we determined that the best size for the printouts was approximately the size of a piece of paper (i.e. 8.5 in. x 11 in. or 21.59 cm x 27.94 cm). However, to improve the quality of the print, we experimented with various orientations deciding to print vertically (swapping y and z) thereby producing the smoothest, largest object possible. We printed pieces approximately 8 in. long and .8 in. thick, (20.3 cm and 2.03 cm for the “x” and “y” stage, respectively) and 6 in. (or 15.2 cm) high. One such piece takes 6 hours to print. We printed two pieces and joined them together by hand to create one complete print out.
From Astronomical Data to 3D Print
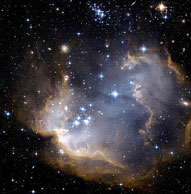
The astronomical object we selected for prototyping the 3D print process is NGC 602, a region where young stars are forming from a cloud of gas and dust that is located in a neighboring galaxy called the Small Magellanic Cloud (Figure 2). The Advanced Camera for Surveys (“Advanced camera for surveys,” 2014) on the Hubble Space Telescope was used to observe NGC 602. An examination of the image of NGC 602 revealed the locations of three major components: stars, regions of dust, and regions of gas. As our guiding assumption is that 3D printed objects must provide information through the sense of touch that is similar to information provided by viewing visual images, we determined that these were the three main astronomical components we needed to convey in a tactile manner. We delineated each feature in the image graphically and digitally measured them to determine the intensity (brightness) of that feature. All this information was recorded in a spreadsheet and processed with our own custom software (to be described in a separate paper) to produce a digital data file that depicts the intensity of the features at each (x, y) position in the image.
Figure 2: The star forming region, NGC 2. The image is from data taken with the Advanced Camera for Surveys on the Hubble Space Telescope. North is up and East is to the left in this view. Regions of dust are seen as yellowish and the bluish regions are primarily dust. The main body of the star cluster is the V-shaped clump of stars in the lower left quadrant of the image.
Introducing the Use of Textures to Convey Scientific Information
When translating an image that in its inherent form is a visual medium into a tactile representation, both the detailed components of the image as well as the overall impression of the image are important. Different learners explore imagery in different ways. Therefore, in tactile materials both the overall picture and easily distinguishable individual aspects must be cohesively related in order for a reasonable mental image to be constructed by the user.
Creating a useful tactile graphic image from the visual version involves representing the shapes, colors, and relative locations of features. In astronomy, color is often used to highlight different scientific aspects in an astronomical image, such as emission from a specific chemical element or stars of different temperatures. Additionally, other structures such as filaments, gas, dust, and complex areas of nebulae and galaxies also have specific shapes and intensities.
For decades, teachers of the visually impaired have been creating multiple copies of touchable pictures for their students through three main options. In one method, images are reproduced by printing onto a plastic Braillon page with the use of a thermoform (heat vacuum) machine. In the second method, an image is designed with a computer and printed on paper with a Braille embosser.
Rather than use a thermoform machine or Braille embosser, we began this project using a third method. The tactile designs were developed on a computer, and then copied onto capsule paper (also called Swell-Touch or thermal expansion paper) and run through a Swell-Form machine. In this way, the areas on the page that have black ink puff up and become touchable. The 2-dimensional images on the thermal expansion paper became a starting point for testing design changes before transferring the designs into a 3D representation.
Informed by all the work that went into the traditional use of Swell-Forms and Braille embossers to convey information to visually impaired users, we experimented with using different textures on our 3D printer to indicate the specific physical attributes of the astronomical image. A reasonable texture palette might include point-like symbols of different shapes, lines of various thicknesses, and areas that feel rough, smooth, or jagged.
The map of NGC 602 described above, with the different components (gas, dust, and stars) graphically identified, served as a reference for assigning a series of textural elements to represent the features of the object that had also been analytically measured. We tested various textures including horizontal lines, dotted lines, arrays of triangles, and cross hatching for the gas and dust, with circles and indented circles for the stars. At the end of the testing series conducted between July and December 2013 (described in the next section), we assigned horizontal lines to dust, pebbled texture to gas, and a coarser pebbled texture to areas where dust and gas were combined. Small circles with a central indentation were used to identify individual stars. The textured files, generated with our own customized software, were used to generate an evolving series of representations of NGC 602 in two main map forms, both printed on the MakerBot2:
1) A texture map containing tactile textures representing the features (Figure 3).
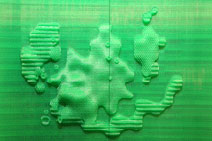
2) An elevation map where intensity information was added onto the same textures (Figure 4).
The texture map is the 3D print equivalent of a Swell-Touch paper image. It is mostly flat, but provides the location of the different features, identified by different raised textures. The elevation map, as the name implies, is an undulating surface where texture is added to the map of the relative intensities of the various features. In the case of NGC 602 the brightest features were the stars in the central cluster, but the elevation map also allowed the user to distinguish the relative intensities of the gas and dust regions that all were represented by unique textures.
Figure 3. 3D texture map of NGC 602 produced on the Makerbot2. Unique textures represent different features in the visual image.
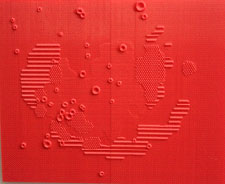
Figure 4. 3D elevation map of NGC 602 produced on the Makerbot2. As in Figure 3, unique textures represent different features in the visual image. The elevation or “z” height of the print out corresponds to the intensity of the features as measured analytically in the Hubble’s data.
Iterative Testing of Textures
We organized four group tests to assess the products of our evolving process. At each testing step, we refined and improved our products to make the identification of features in the 3D print easier. We used questionnaires to evaluate the overall usefulness of our effort, including questions regarding the overall impression of NGC 602 and the ability to distinguish the features. This testing phase laid the ground work for producing 3D prints that in the future will be used in educational settings to establish how the materials support and augment learning. In chronological order, we describe the tests we performed and the main conclusion from each test.
National Federation of the Blind (NFB) Annual Convention, July 2-6, 2013
The participants in this first test group were blind adults. This session tested a very early version of our 3D prints, together with Swell-Form touchable images of the same astronomical object, NGC 602. The assessment was made by first reading a description of NGC 602 while participants examined each model. At that point, each participant was asked to first locate each textured area on the Swell-Touch page followed by finding that same area on the 3D texture map. Fifteen blind and visually impaired participants evaluated the Swell-Touch page and the 3D texturemap. All participants could identify the star symbols on the Swell-Touch page and on the 3D texture map. However, participants were less successful with identifying some of the other textures.
The elevation model was also presented while allowing the participants to record anecdotal comments about its value to the end user. This test and the second test (just below) resulted in a revision of sizing of the 3D prints and the textures being used.
NFB STEM-X at Towson University, July 29, 2013
The participants at this second test group included blind middle school students and adults. Rather than using one composite Swell-Touch page as a reference, a series of four pages was created that corresponded to each of the individual textures on the 3D texture map. In this evaluation, textures were introduced one by one. The elevationmodel was not included in this testing.
The results were very favorable. Almost all participants could locate the textured elements when they were introduced one by one. However, there was a consensus that some of the textures selected should be replaced by something else because they were not easy to identify, especially on the 3D prints.
For these two first test sessions, our 3D prints were 4x4 inches in size. One of the main findings was that in order to be understandable the 3D print had to have a size comparable to the Swell-Touch page (8.5 in. x 11 in. or 21.59 cm x 27.94 cm). It was also evident that textures must be more distinctive so that transitions from one region to the other can be perceived by touch. Similarly, textures from one side of an image to the other must be consistent so that the overall impression of the image is true to the original.
After the first two test sessions, a decision was made to print and test only larger 3D frames, as discussed in the production section above. By gluing together two prints, each approximately 8 in. x 5 in. (20.32 cm x 12.7 cm) in size, we could present 3D prints that were approximately 8 in. x 10 in. (20.32 cm x 25.4 cm) in size.
NFB Connecticut and Maryland State Conventions, November 2013
Both 3D textureand elevation maps (in the larger format) were presented for evaluation in November 2013. The participants’ ages and degrees of vision impairment both varied within a range. For orientation, a description was read to each participant while some participants with partial vision examined the visual color image of NGC 602. Participants then examined a 3D printed texturekey to familiarize themselves with the specific textures. They then proceeded to examine the 3D texture map to get a sense of the object’s shape and overall composition. Finally, they examined the 3D elevation map and answered questions for a survey. At this point in the testing, most participants felt that the Swell-Touch material was no longer needed. Therefore, only 3D printed maps were subsequently evaluated.
The (third) test group in Connecticut consisted of people who were born blind or visually impaired and people who lost their sight later in life. Almost everyone could find the textures on the 3Dtexture map. Many of these individuals had also assisted in evaluating texture samples after the July testing series, but they had not tested the 3D maps. Most people could also identify the areas on the 3D elevation map. It was interesting to note that participants who lost their sight later in life preferred to start with the 3D texturemap, rather than the elevation map, and thought that some textures (specifically the gas) were harder to find in the elevationmap. Conversely, participants who were tactile readers throughout their life often preferred the 3D elevation map with some feeling they could understand elevation maps without an introduction to texture maps. All agreed that having both versions of the model offered non-visual access to a larger number of people.
The (fourth) test group in Maryland included a few staff from the NFB Jernigan Institute. These participants may have had more experience using tactile graphics and as a result often chose the 3D elevationmap as more informative. Many other individuals participated in the testing as well. Experienced users felt the 3D texture map was interesting but necessary for an introduction to NGC 602 or for presenting the concepts to less experienced users.
Focus group testing was critical to the success of this project. Moving from the familiar medium of Swell-Form paper to the smooth feel of a 3D print required a different approach to the tactile design. The decision to deviate the production from a small low-resolution model to a larger format 3D print also contributed to successful iterations in design and evaluation. Note smaller format prints are easier and faster to produce but, as our testers articulated, are less useful. As a result of the NFB Connecticut State Convention testing, the gas texture was modified to be slightly rougher so it could be distinguished more easily in the 3D elevationmap.
The final 3D textureand elevation maps were presented and shared with astronomers and educators at the January 2014 meeting of the American Astronomical Society. These are the prints shown in Figure 3 and Figure 4.
Concluding Reflections and Future Plans
We have demonstrated that it is possible, by using existing software augmented with custom algorithms, to create 3D representations of astronomical objects, specifically of images taken by the Hubble Space Telescope. Our purpose is to share Hubble imagery with visually impaired audiences through tactile materials so they can get a sense of astronomical objects.
Our process used a low-end printer, as opposed to expensive and sophisticated commercial printers, because low-end printers are becoming typical for use in schools, libraries, museums, and homes. While the low-end printer is not capable of the highest resolution contained in the Hubble’s data, it can satisfactorily convey the key scientific content of the data. We created a process to represent the astronomical data in the STL 3D digital printer file format. We tested a variety of textures and sizes of printouts to represent the data based on feedback from focus groups. We created two types of printouts on the 3D printer: a texture map, which uses unique textures to represent the features in the image, and an elevation map, which uses the same textures, but also represents intensities of features as height or elevation. We identified optimal textures and the ideal printout size (8 in. x 10 in. or 20.3 cm x 25.4 cm) to use, which is reasonably sized, understandable, manipulable, and producible.
In the near future, our next step is to include in the 3D prints the distance of the various features from the observer in addition to texture and intensity information. The challenge there will be to understand the spatial structure of the astronomical object in three dimensions (x, y, and z) and to effectively render the three dimensions for 3D printing. This could be done either through multiple print layers that would allow the user to explore the object from near to far, or by constructing a roughly spherical, geode-like object that people would be able to hold in their hands.
In the longer term, we hope to generalize the process so that it can be applied to a variety of astronomical images beyond our test case. We envision the possibility to make available a library of such files for printing. Further, we are collaborating with visualization experts to create a method so that scientists producing imagery and associated measurements can manipulate their own data into the appropriate file formats for 3D printing. This will involve a custom interface for scientists and a translation mechanism from the interface and science data to a program that can produce 3D print files.
3D printers are becoming more affordable to consumers. Many public libraries are purchasing 3D printers for use by visitors and schools are purchasing them for classrooms. We will continue targeting the lower end of the market (i.e. Makerbot and other similar printers) as they will be more widely available to the public and educators. Higher end printers will be tested for applications such as one-off museum and library exhibits. The data can also be tested on higher end printers to learn more about the output of those devices, which still need some hands-on tuning in the form of polishing and cleaning.
Eventually, we do believe that 3D prints will become the primary materials used for presenting astrophysical concepts to visually impaired and non-visual learners. Such models can be supplemental resources for new releases through Internet distribution of the 3D graphic files for printing by the user. They can augment informal science displays of astronomical information, exhibits, and planetarium shows, and become supplemental materials for science classes covering astronomical topics.
We believe that these 3D materials will eventually level the playing field for all learners.
References
Advanced Camera for Surveys. (2014). http://www.stsci.edu/instruments/acs/. Retrieved January 1, 2014, from http://www.stsci.edu/instruments/acs/
American Printing House for the Blind. (2011). Annual report 2011: Distribution of eligible students based on the Federal Quota Census of January 4, 2010 (Fiscal Year 2011). Retrieved from http://www.aph.org/federal-quota/dist11.html
Ford, H., Bartko, F., Bely, P., Broadhurst, T. Burrows, C., Cheng, C., . . . Woodruff B. (1998). Advanced Camera for the Hubble Camera. In P. Y. Bely & J. B. Breckenridge (eds.), Proceedings of SPIE Volume 3356 Space Telescopes and Instruments V. Retrieved from http://acs.pha.jhu.edu/instrument/papers/documents/spiefinal.pdf
Grice, N. (2007). Resources for making astronomy accessible for blind and visually impaired students. Astronomy Education Review, 5(1), 154-157.
Hull, C. W. (1986). U. S. Patent No. 4,575.330A. Washington, DC: U. S. Patent and Trademark Office.
Jaquiss, R. S. (2011). An introduction to tactile graphics. Journal of Blindness Innovation and Research, 1(2). doi: 10.5241/2F1-6
Jaquiss, R. S. (2012). Advanced technology for producing tactile materials. Braille Monitor, 55(4). Retrieved from https://nfb.org/images/nfb/publications/bm/bm12/bm1204/bm120407.htm
Jaquiss, R. S. (2013). Producing tactile materials, an update. Braille Monitor, 56(11). Retrieved from https://nfb.org/images/nfb/publications/bm/bm13/bm1311/bm131105.htm
Rosenberg, M., Russo, P., Bladon, G., & Christensen, L.L. (2014). Astronomy in everyday life. Retrieved from http://www.iau.org/public/themes/why_is_astronomy_important/
SPIE Professional. (2013). Chuck Hull: Pioneer in stereolithography. SPIE Professional. doi: 10.1117/2.4201301.03
The Journal of Blindness Innovation and Research is copyright (c) 2015 to the National Federation of the Blind.